Pre-Purchase Building Inspections that reduce uncertainty
Insurance assessment experience for all main insurers since 2009. IICRC Water Damage Restoration Technician (2009). 2,500+ home inspections completed.
Services
Pre-Purchase Inspections
Independent assessment before you buy, with clear findings and practical recommendations.
Pre-Sale Advice to Vendors
Identify risks and improvements before listing, so the sale process is smoother and more defensible.
Second Opinions on Existing Reports
If you've received a report and want a sober, technical review, we'll verify and clarify what matters.
Delivery timeline
Reports are issued within two business days of the inspection.
What to expect from booking to report
A clear four-step process from your first enquiry through to your finished report.
Book online
Fill out the enquiry form with your property details and preferred dates. We'll confirm scope and access arrangements with you directly.
Inspection carried out
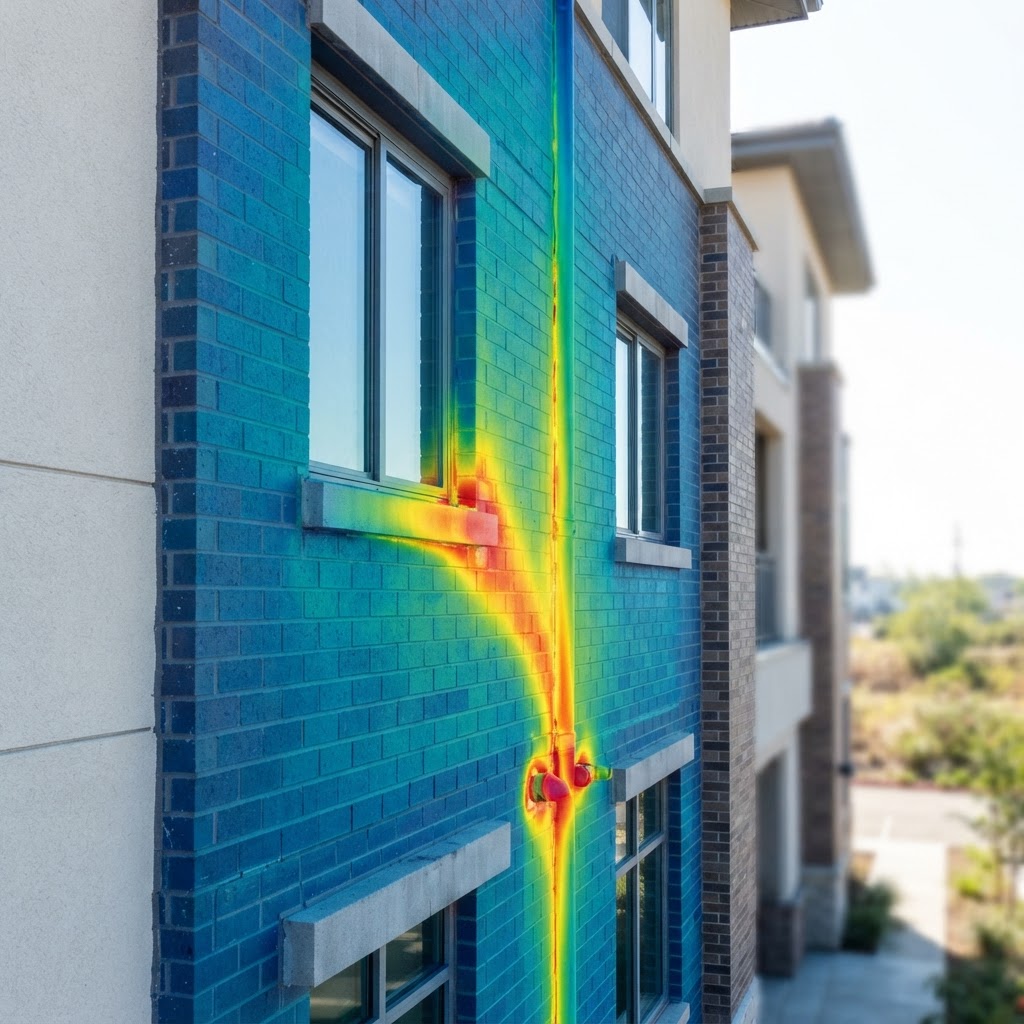
We attend on-site and conduct the full inspection — including moisture survey and thermal imaging. You're welcome to join the walk-through.
Report compiled
Findings, photographs, moisture readings and thermal images are compiled into your written report with clear risk ratings and recommendations.
Report delivered
Your completed report is issued within two business days of the inspection, ready to support your purchase decision.
Understanding where New Zealand homes leak
Based on Prendos and BRANZ seminar material from 2002, the chart below summarises where leaks were found across roughly 1,329 documented cases. Balcony leaks, window installation, and roof leaks together account for about 74% of all leaks — worth knowing where to look first.
| Rank | Leak Type | Category | Approx. Leaks | % of Total |
|---|---|---|---|---|
| 1 | Balcony Leaks | Water Source | ~400 | 30.1% |
| 2 | Window & Door Installation | Joinery | ~305 | 22.9% |
| 3 | Roof Leaks | Water Source | ~280 | 21.1% |
| 4 | Cladding to paving | Capillary | ~115 | 8.7% |
| 5 | Cladding | Wall | ~75 | 5.6% |
| 6 | Cladding to ground | Capillary | ~50 | 3.8% |
| 7 | Cladding to balcony | Capillary | ~48 | 3.6% |
| 8 | Inadequate subfloor ventilation | Other | ~33 | 2.5% |
| 9 | Shower leaks | Other | ~9 | 0.7% |
| 10 | Retaining wall | Other | ~8 | 0.6% |
| 11 | Cladding to roof/gutter | Capillary | ~3 | 0.2% |
| 11 | Plumbing leaks | Other | ~3 | 0.2% |
| Total (top 3 = ~74%) | ~1,329 | 100% | ||
Relative size of leak sources
Bar length is proportional to the approximate number of leaks. Colours group leaks by category.
Percentages are relative to the 12 items shown and will shift if excluded Wall sub-items or Roof/Balcony breakdowns are added back. Source: Prendos and BRANZ seminar material, 2002.
Frequently asked questions
Everything you need to know about booking and getting your report.